KiWorks
Visualizing Data Relationships in an Open-Ended Digital Canvas
UX Designer | Early-Stage Conceptual Product / 2015 - 2019
KiWorks was a conceptual collaboration platform created to address the friction scientists face when organizing data, working with peers, and solving complex problems visually. Designed as an interactive canvas, KiWorks brought together linked data visualizations and shared workspaces into a single, modular experience.

My Role
Sole UX Designer and conceptual lead. Created initial concept, interaction model, UI system, and prototyped core flows. Conducted desk research and informed the platform’s structure through patterns in existing scientific tooling and whiteboarding practices.
Timeline: 2015 - 2019
Team
Company Founder / Head of Organization
Senior Engineer
Engineers (x3)
Lead Product Designer
Legal Consultants


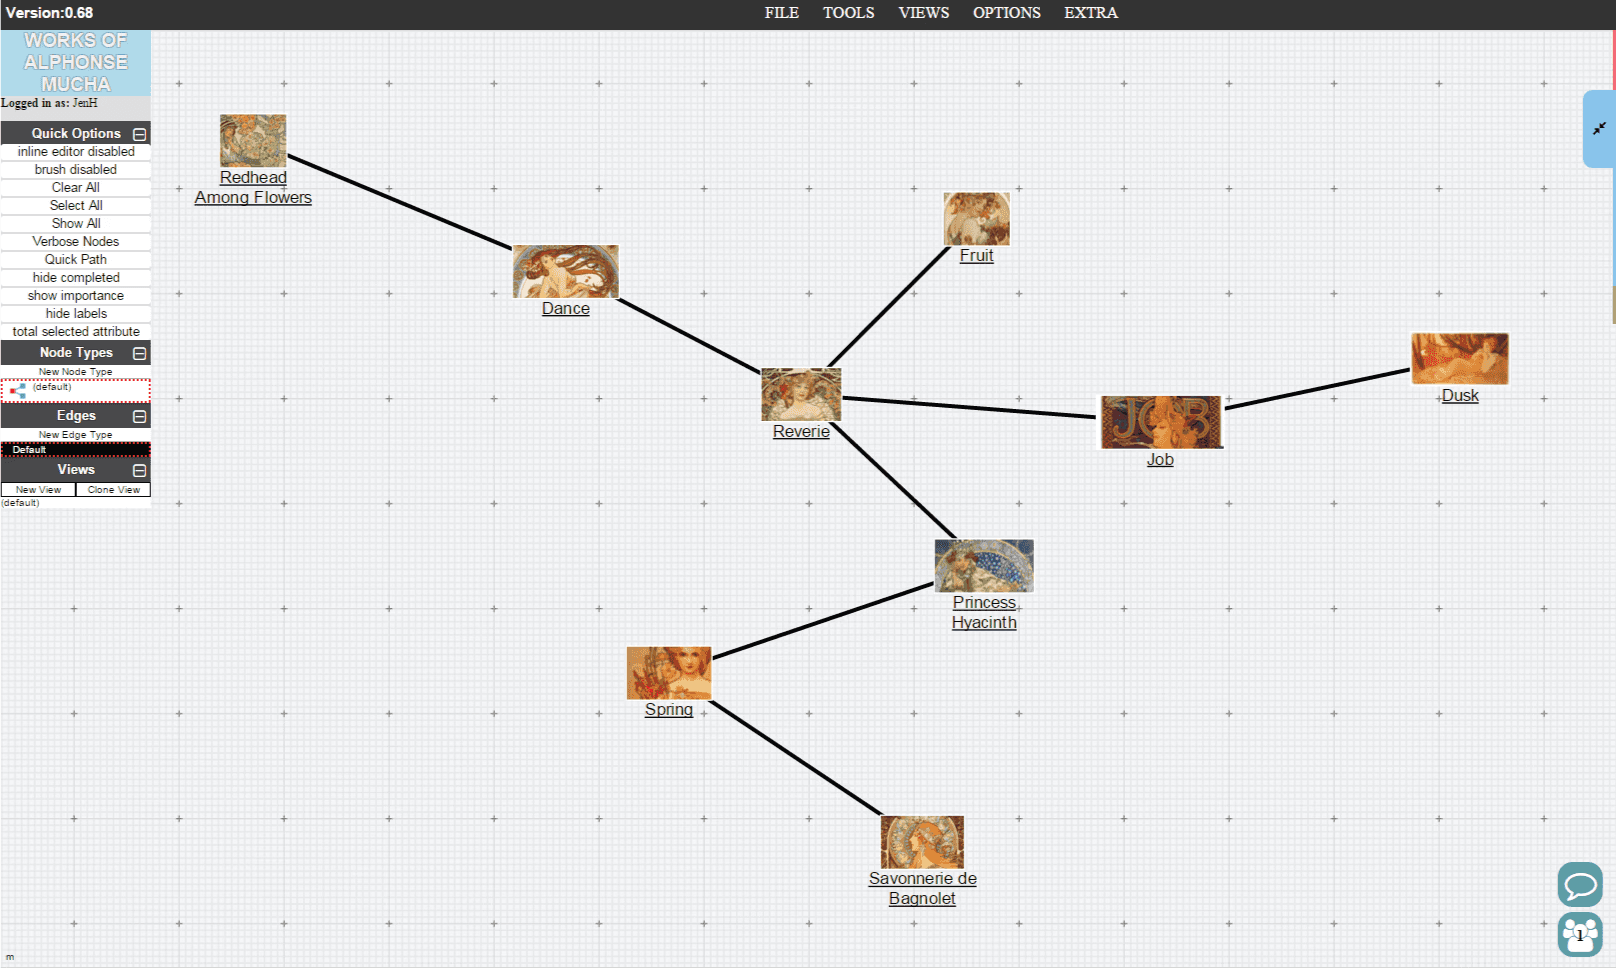
Example of a blank KiWorks canvas versus a populated one.
Problem Space
Users often rely on disconnected systems - whiteboards, lab notebooks, screenshots, emails - to collaborate and solve problems. The lack of an integrated digital space for thinking, visualizing and connecting ideas slows down decision-making and teamwork.

Primary Goals
Create a central digital canvas for collaborative collaborative problem solving
Enable modular, node-based idea building with intuitive linking and spatial flexibility
Integrate data visualization, contextual documentation, and conversations
Build an interface that feels intuitive, tactile and low-friction

Original sketch of the "Articulator" before it became "KiWorks" several iterations later.
Approach
Conducted informal interviews and reviews of how users organize their work across analog and digital tools
Audited whiteboarding, brainstorming, and documentation behaviors from early adopters and professionals
Synthesized key actions like grouping, sequencing, annotating and summarizing across media
Key Insights
Users need flexible ways to externalize thinking, not just capture results
Relationships between ideas are just as important as the ideas themselves
Collaboration often requires surfacing layers of complexity without overwhelming the user
Core Components
Nodes: represent discrete pieces of knowledge or concepts (e.g., questions, methods, results)Relationships between ideas are just as important as the ideas themselves
Edges: directional connections between nodes that hold metadata about their relationship
Cards: visual representations of nodes containing questions, methods, data and comments
Side panel: offers linked content or context-aware resources
Interaction Highlights
Tap-to-expand, drag-to-group, and long-press-to-reveal mechanics
Emphasis on maintaining clarity during complex layout shifts
Designed for both stylus/touch and desktop keyboard/mouse input
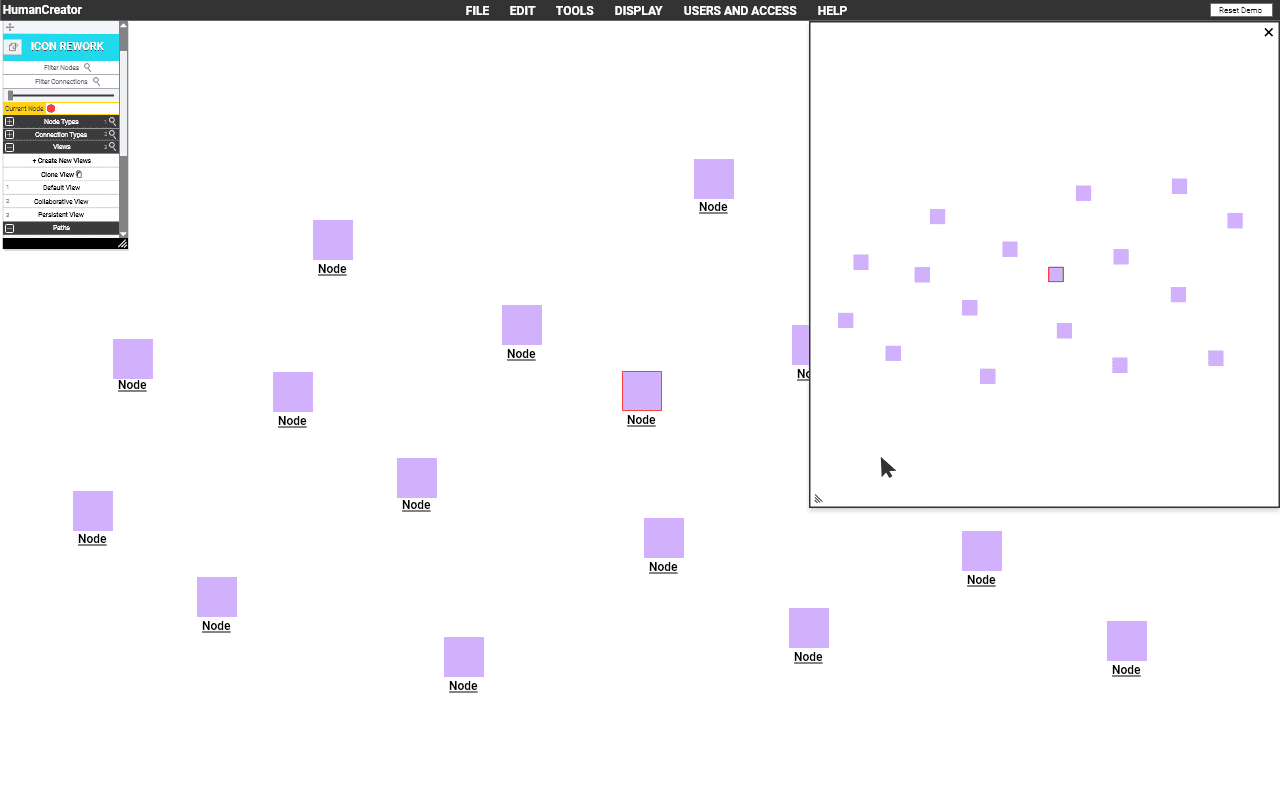
Showcasing a Mini-map feature

Example of the project selection screen/library
Challenge 1
Solution: Introduced snap zones, auto-alignment, and grouping tools to keep canvases readable
Challenge 2
Solution: Created optional starter templates and task-based guides to scaffold workflows while maintaining flexibility
Challenge 3
Solution: Built connector logic with hover-to-highlight and thread group features to reduce mental load
KiWorks had the foundation for expansion into:
🧠 AI-Driven Clustering: Suggesting relationships and surfacing hidden insights
🧩 Collaboration Mode: Live multi-user sessions for strategic planning
🗺️ Scenario Design: Explore the possibility of adapting the platform for immersive use in VR/MR environments to support spatial problem solving at scale
🎨 Custom Visual Languages: Allowing users to define their own node types, color systems and map structures
